To spread usage of building models, it is important to provide easy to use interfaces to extract data from these models. Being able to see a model and interact with it is a good first step. The next one is obliviously being able to extract quantities from this model.
My first attempt at creating a quantity take-off system for bimsync assumed that all the models I wanted to analyse will follow the same structure. This was necessary to be able to create a first dashboard and then keep meaningful results in this dashboard as the model evolved. But a lot of models I receive don’t follow a rigorous enough structure to be able to extract them through a Power BI dashboard.
I wanted to be able to analyse less structured models. So, I needed something different than my previous dashboard-based solution.
I looked for inspiration in many quantity take-off systems from various software packages. I took notice of the one from of Solibri, which I found quite good. I also drew inspiration from the pivot table systems available in Excel and Power BI. The main idea was to replicate the principle of the pivot table on a building model.
With these ideas in mind, I drew a few sketches to refine my solution and find the user interface I was looking for:
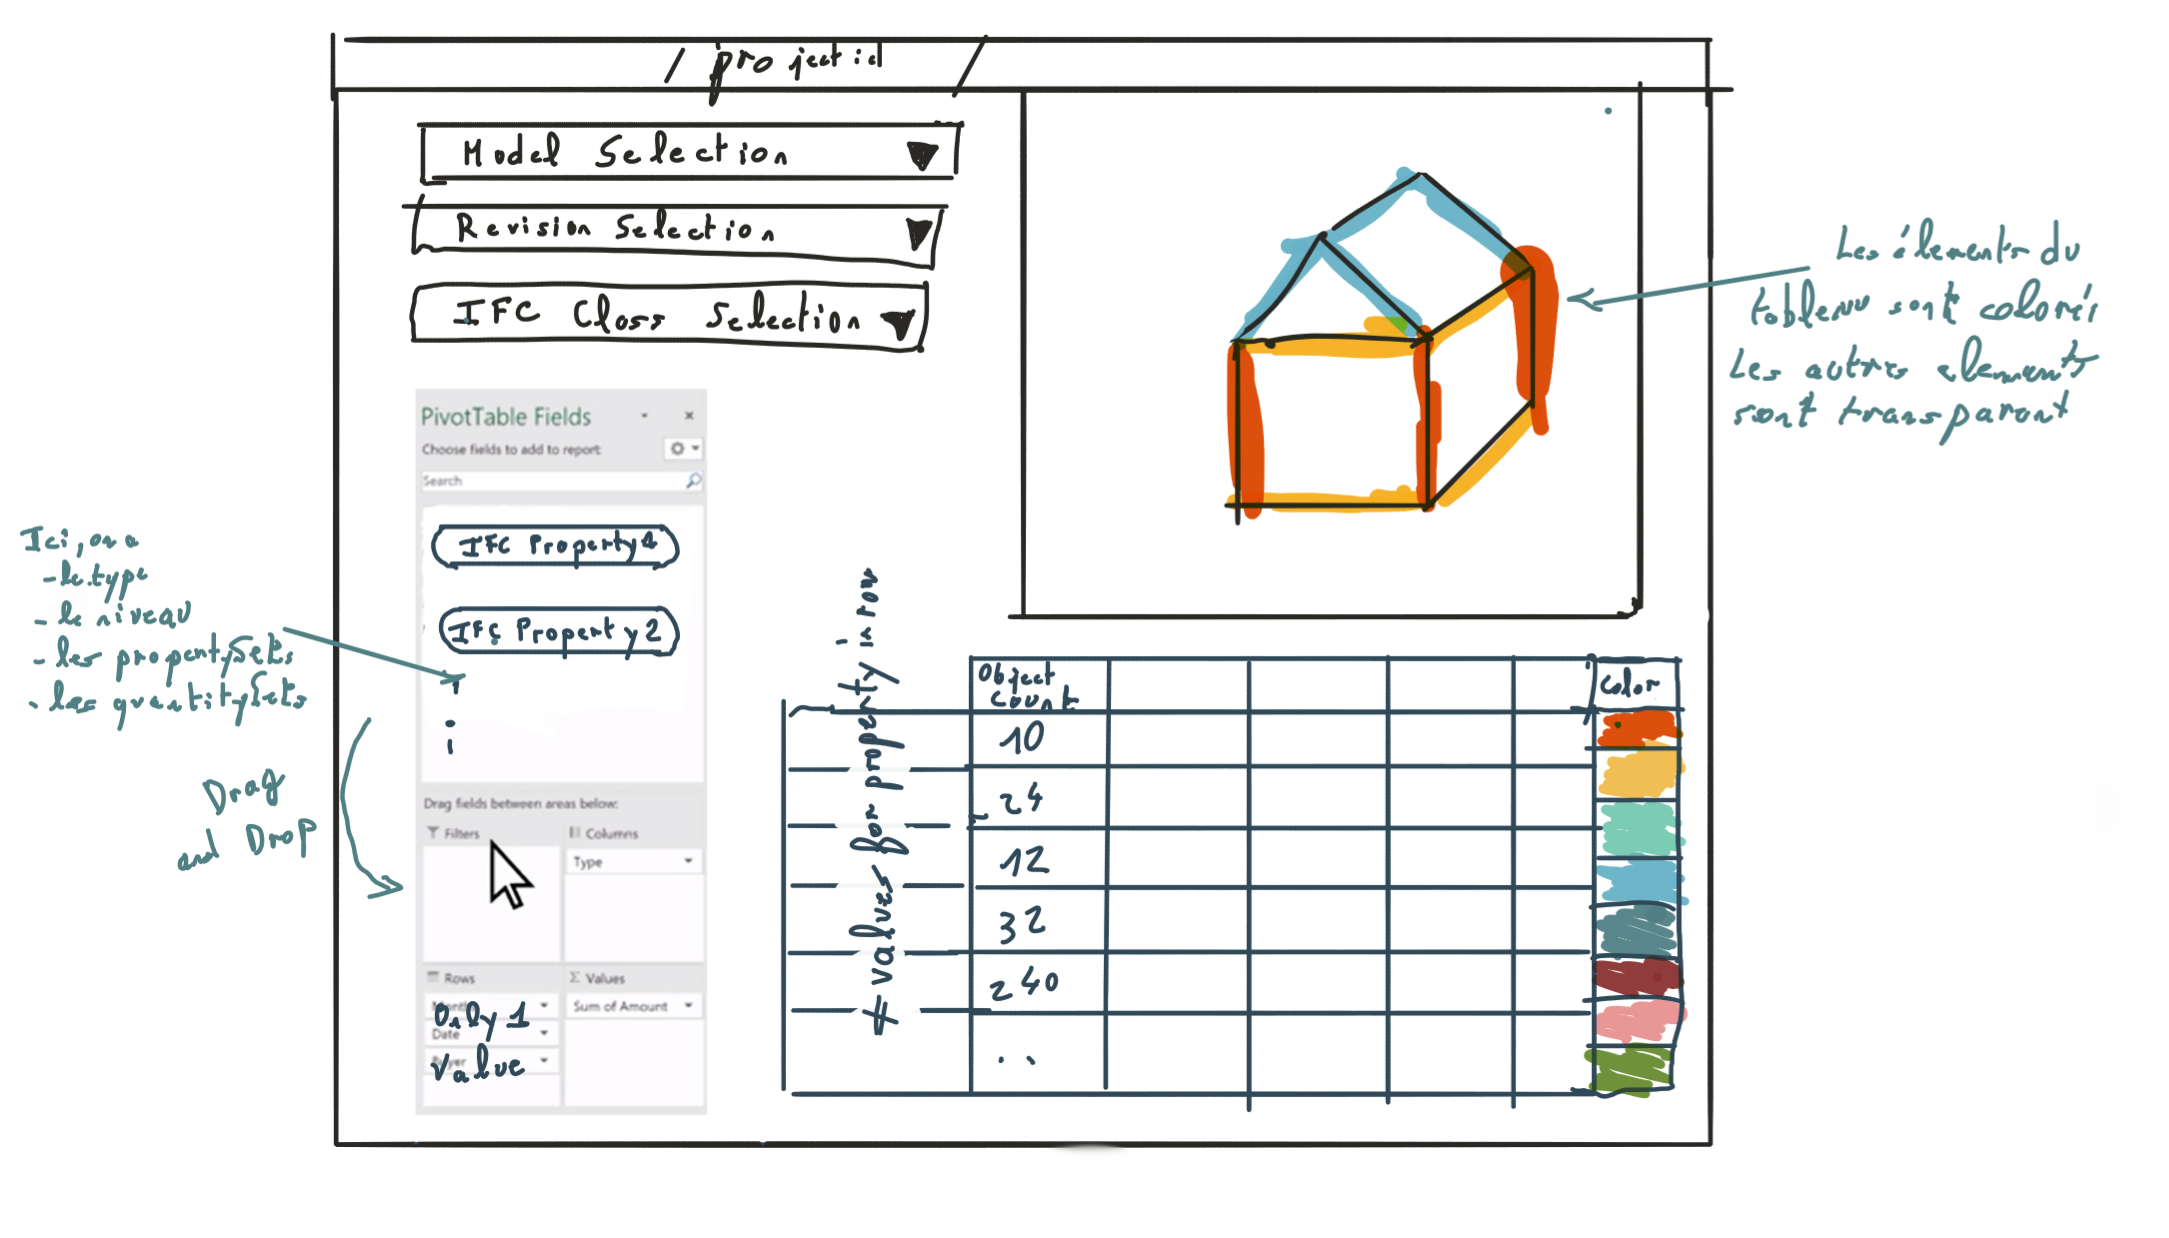
After a few iterations, I came up with a first version of my quantity take-off system for bimsync. You can now use it on your own models in bimsyncManager. This quantity take-off system will display in colors all the elements you are quantifying, providing a very visual way of extracting quantities. You can also select the properties you want to display and group them just like an Excel pivot table.
Let see how to use it:
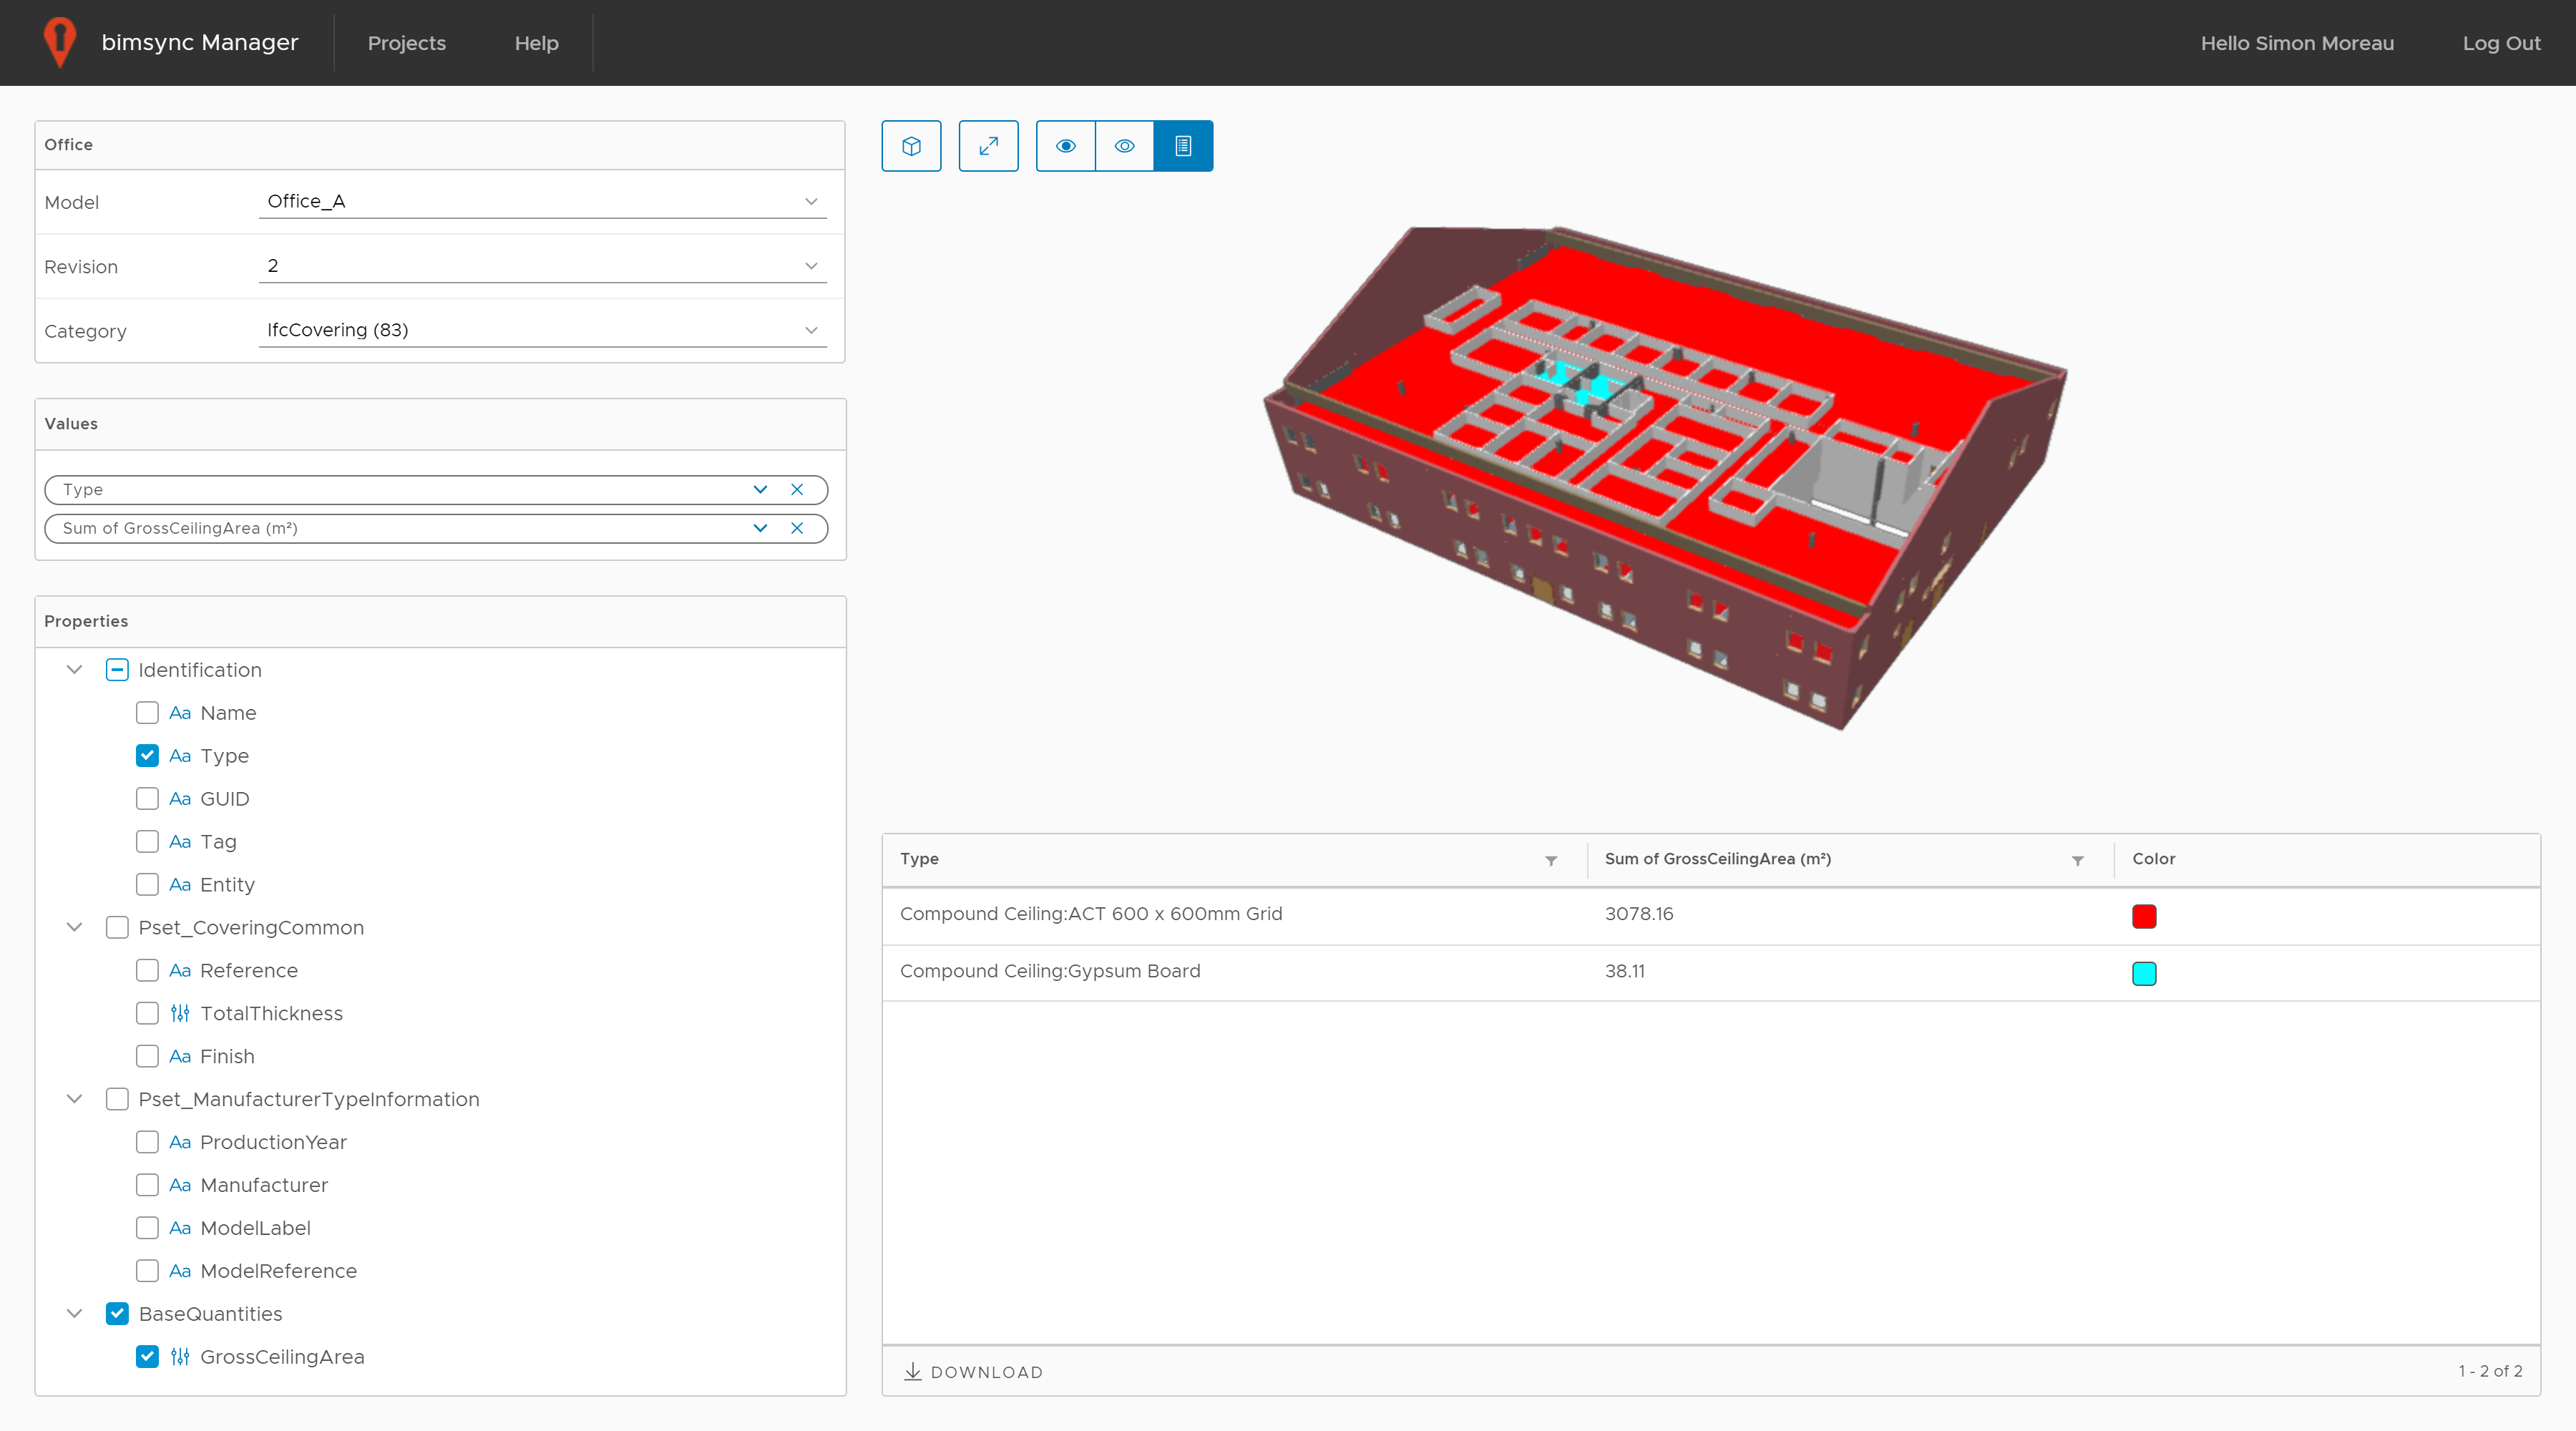
In your project list, click on the chart icon to open the quantity take-off interface. Select your model, its revision and the IFC class of the elements you want to quantify. A list of the associated properties is loaded below. Select or drag and drop some of these properties to group your elements.
A table summarizing the results appears below your model. Selected elements are also displayed in colors:
Drag and drop new properties and select how you want to group each one of them. For example, we can count how many walls of each type we have by counting Guids. You can also add the GrossSideArea and select Sum to get the total area for each type:
bimsyncManager highlight in color every selected element. You can also hide or make translucent the others to fully understand in a visual way what are the elements you are quantifying. A more conventional feature, you can select a specific element to have a detailed view of its properties:
When the information you retrieved is satisfying, you can download the resulting table as a spreadsheet to analyse it further.
The solution is now freely available as a public beta on bimsyncManager. Don’t hesitate to share your feedback or issues you might encounter, I will try to address them. As usual, the entire solution is open source and available on the bimsyncManager Github repository. If you want to contribute, I would be happy to integrate your Pull Requests.