I recently had to work with the BMS system of my office building and study how to retrofit it with new web-based technologies. I am by no mean even slightly knowledgeable about these systems, but this gave me a few ideas to explore.
For example, I wanted to measure temperature and humidity in my apartment to understand thermal conditions and optimise comfort in my own home.
I first looked into integrated home monitoring systems, but they are more expensive that I wish to spend on this small experiment. Furthermore, they mostly work with proprietary software solutions and offer little possibility for tinkering.
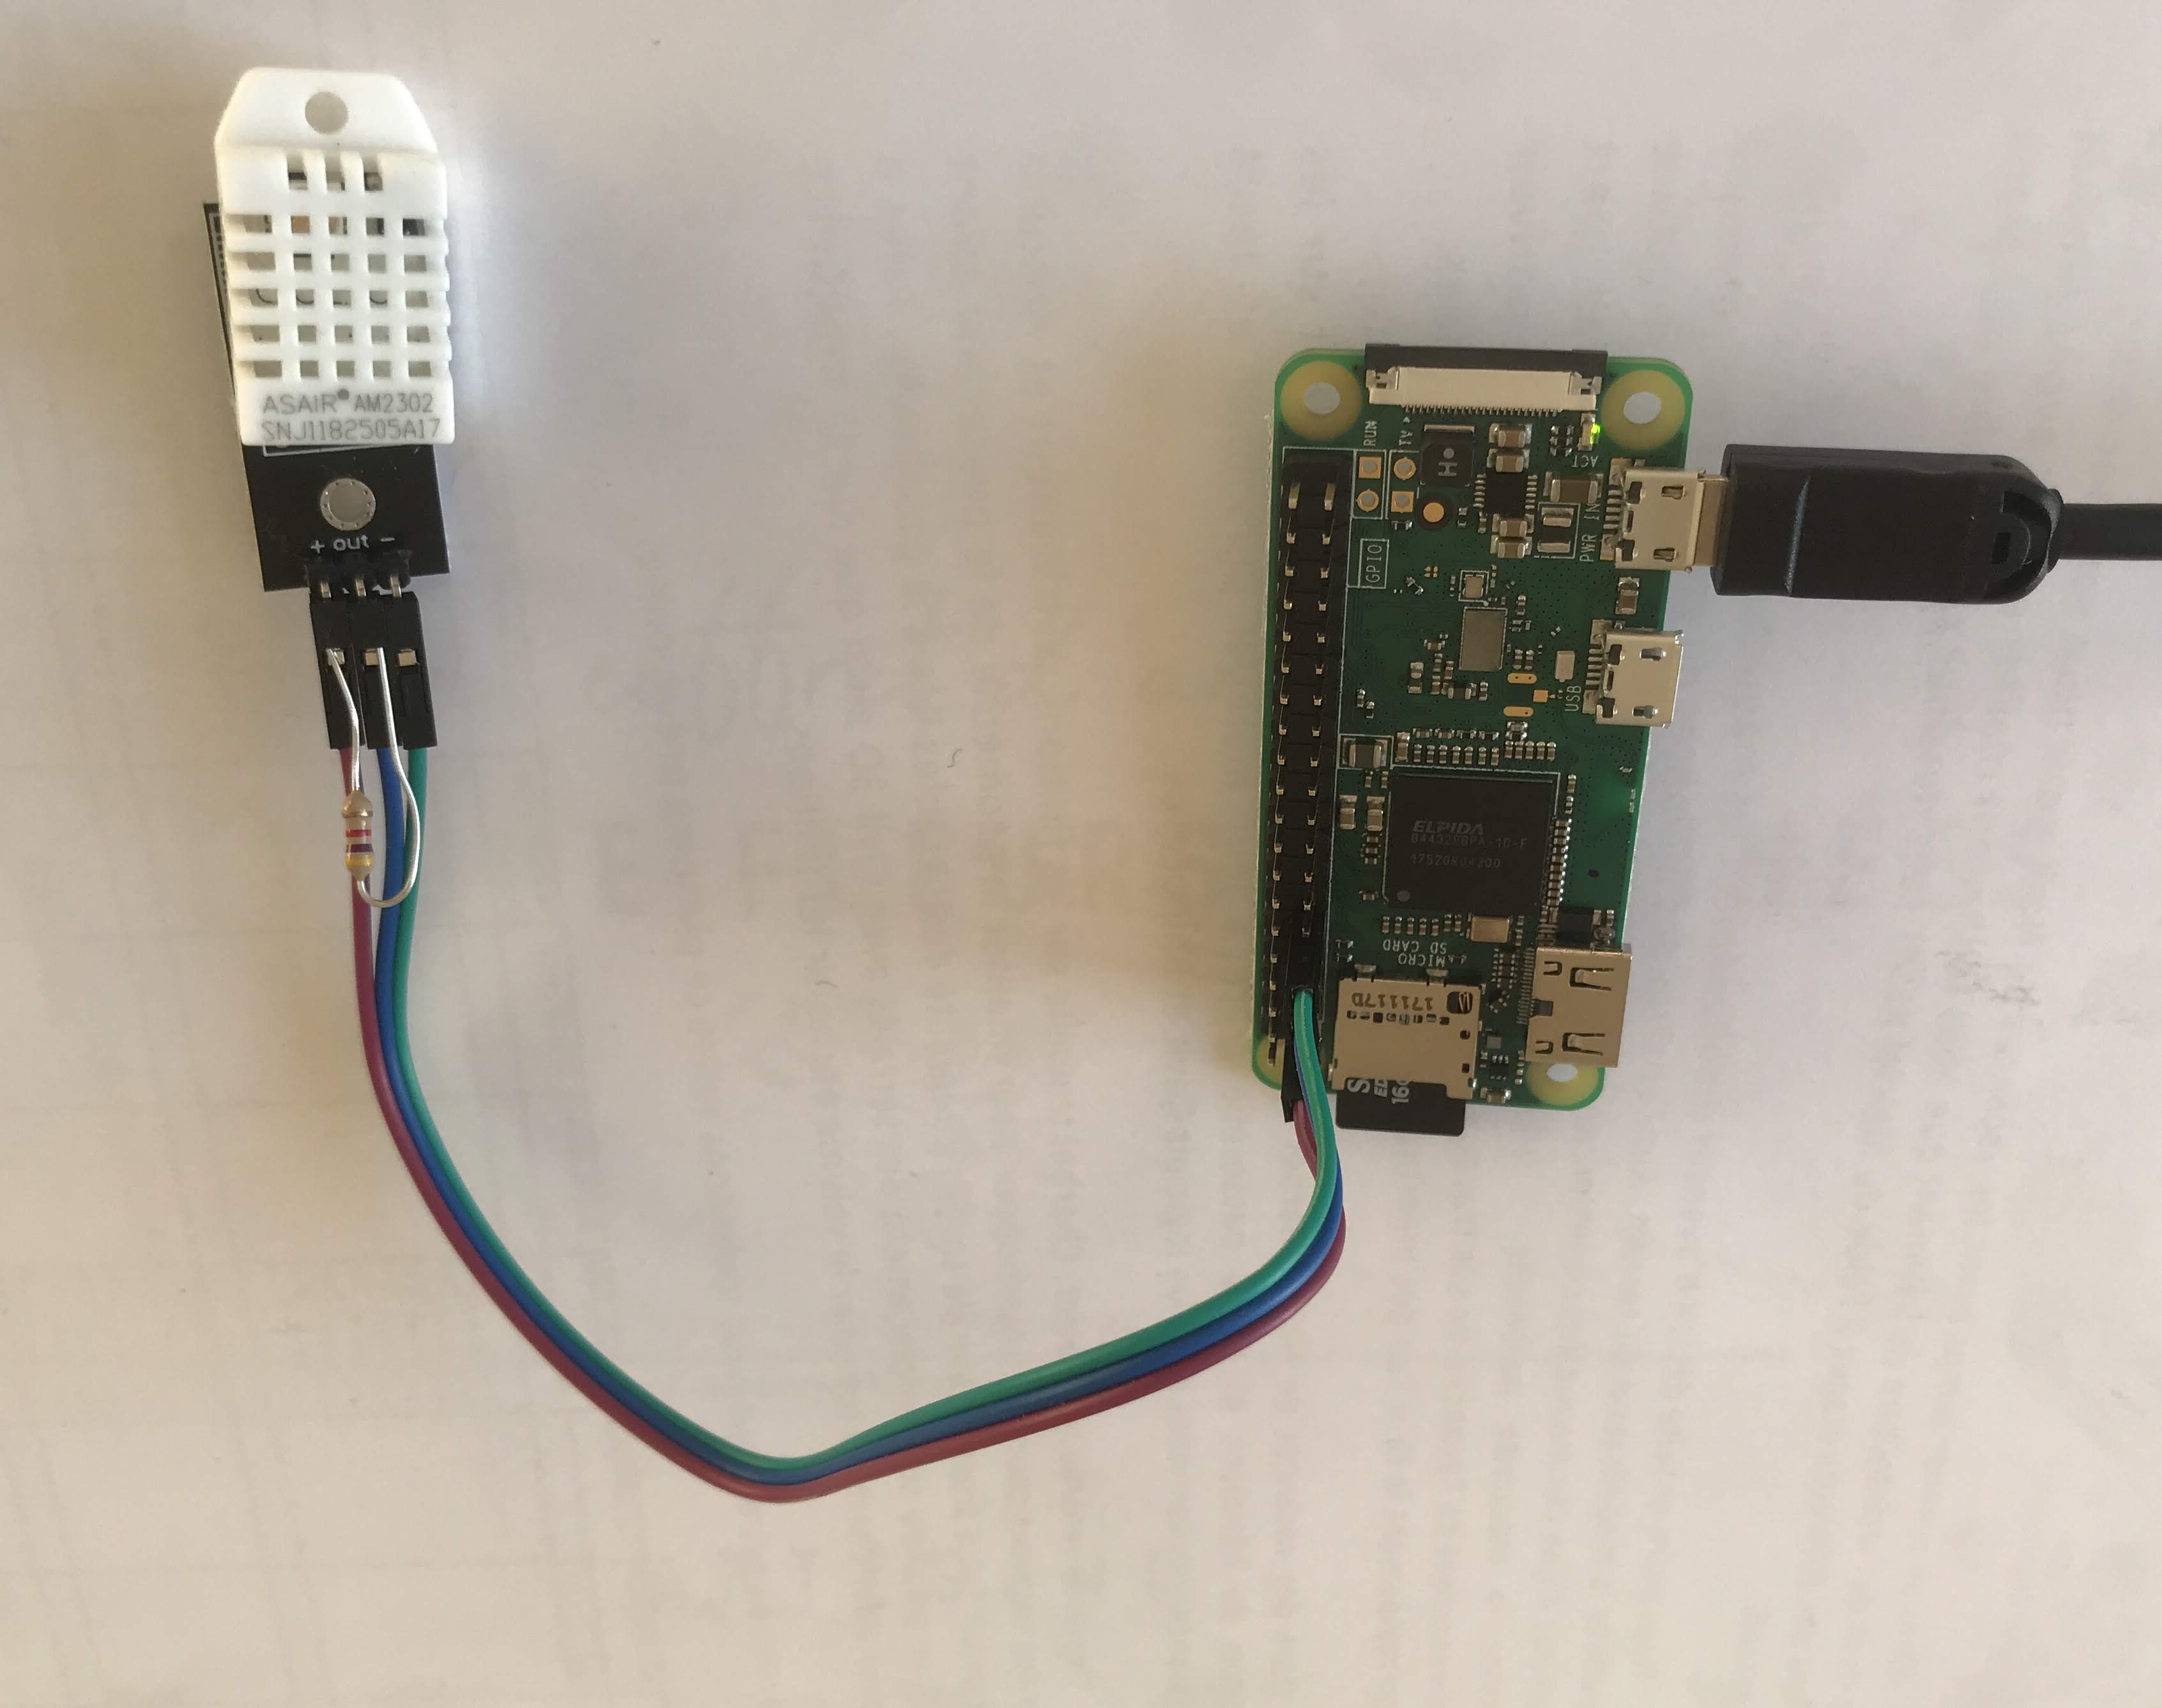
Instead, I ordered two Raspberry Pi Zero W along with two DHT22 humidity and temperature sensors to build my own Wifi enabled indoor thermometer and humidity monitor. Since I will need to use the GPIO interface of the Raspberry Pi, I ordered the H version of the Raspberry Pi Zero W, with pre-soldered headers. This allows me to connect the DHT22 to the GPIO interface of the Raspberry Pi without having to solder it on the board. Following the instructions from this post in Home Automation Community, I quickly plug the sensor into the GPIO interface of the Raspberry.
To read the values coming from the DHT22 sensors, I use the associated Adafruit python library. Just run these commands to install pip, the python package manager and add the Adafruit_DHT library:
sudo apt-get update
sudo apt-get -y install python3-pip
sudo pip3 install Adafruit_DHT
To store the values coming from these sensors, I am using an Azure Cosmos DB database. This solution come with a nice Python library that I will use as well in my project:
sudo pip3 install azure-cosmos
Using the sample provided by Adafruit, I wrote a small python script to read the values coming from the DHT sensors and upload the result to my online database. You can find the resulting script in this Gist.
To run this script, I am using crontab, the Linux job scheduler. Don’t forget to run the crontab with sudo, since the GPIO need sudo permission to be accessed:
sudo crontab -e
To run the command every 5 min, I use the following crontab command:
*/5 * * * * cd /home/smoreau/sources/ && /usr/bin/python3 /home/smoreau/sources/readings.py
This will go in my home dir (cd /home/smoreau/sources/), use python3 (/usr/bin/python3) on the python file (/home/smoreau/sources/readings.py).
Since I have two Raspberry Zero with a DTH22 sensor wired on each, I add the sensorId property to be able to differentiate the values coming from them.
Now that I have temperature and humidity values nicely stored in a database, I need to display them. I started with a simple line graph to get an idea of the evolution of the temperature and the humidity:
As you can see, we can start seeing patterns here. For example, you can see a spike in the temperature around 6 PM every day, when the sun hit the sensor. We can also see that the humidity is inversely correlated to temperature.
But I wanted something a bit fancier to display the sensor values.
I found the work of Kean Walmsley on Project Dasher very interesting and I have often used it to showcase possibilities of connection between IOT and BIM. Inspired by this, I created my own visualization tool for this data.
To create this visualization tool, I am using the Forge viewer with the great wrapper for Angular published by Alan Smith. With a few lines of code, I was able to create a nice visualization tool albeit not very useful:
You can hover over the red dots to display the values coming from the temperature and humidity sensors.
You can find the complete project here.
As usual, the entire source code is available on Github. You can found the front end here (viewer and charts) and the API used to retrieves values from the Cosmos database here.